Since the establishment of the national HPC facilities in 2014 and 2015, the number of scientific publications has only increased. This analysis was first published in DeiC's 2017 Annual Report, with a total of 290 publications being recorded for the period 2015-2017. Later, 60 publications were post-registered for 2016-2017.
Scientific publications are currently being collected from the national HPC facilities, and so far 156 publications are on the list for 2018. New data for the period 2015 to 2018 will be ready for autumn 2019, ie. a four-year term.
This overview draws a landscape of the scientific publications which have included computational power from one of the three National HPC facilities i.e. within Life Science (Computerome), multidisciplinary research (ABACUS2.0) and social sciences and humanities (Cultural Heritage Cluster).
Content of the page
- Collection of publications
- New on the national list
- Numbers and research areas
- Diversity and impact
- Cooperation patterns
- Hot topics in DK-HPC
- Fun facts
- Presentation of the DeiC conference 2019
Collection of publications
Nearly 600 publications highlight the use of national HPC in Danish research in the period 2015 to 2018, and this picture cannot be drawn in the normal bibliographic way. Less than 20% of publications are "captured" by a bibliometric search (It is not written in the "Acknowledgment" or "Funding" field of the publication), and therefore the national HPC users subsequently had to state specifically what computing power they used.
In this analysis, each publication has been verified by HPC users to get a true picture of how many publications have actually included national HPC.
New on the national list
The list now also includes publications from the social sciences and the humanities, which is new compared to the analysis for 2015-2017. In particular, ABACUS2.0 has been the supercomputer behind social science and archeology (Fig. 1, Reference 2-7). The cultural heritage cluster, also called KAC, has been operational since 2018, and publications that have included the use of KAC are expected in the coming years. However, a researcher has already looked at the Danish World Wide Web using KAC (Fig. 1, Reference 1). Hear about Professor Niels Brügger's research in the Danish web (Podcast) or read more here (News).
An overview of publications sorted by year can be found here (The first 500): PUB_YEAR
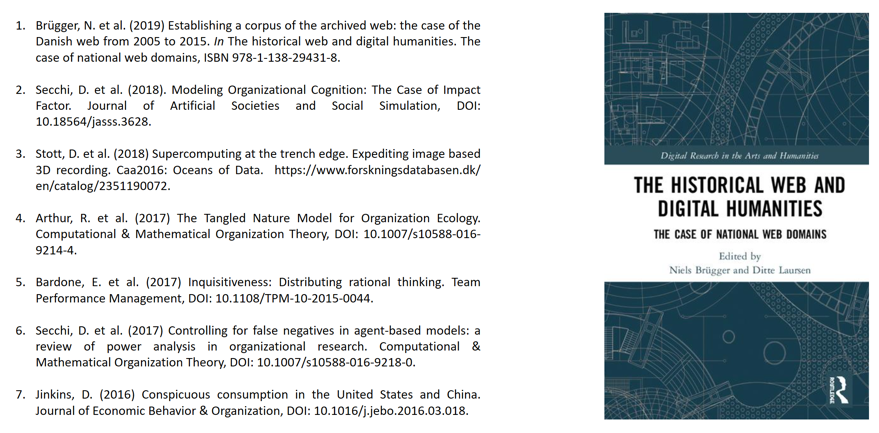
Figure 1. Publications from the social sciences and humanities that includes national HPC in the period 2015 to 2018.
Numbers and research areas
Here is information on research productivity (number of publications) and which research areas have found their way to national supercomputing in DK during the period 2015 to 2018.
- Since the launch of the national HPC facilities, 450 publications that included the use of national HPC have been generated in 2017 and 2018 alone (Fig. 2).
- Most HPC users are in the research areas of Biology (Blue, 29%), Chemistry & Biochemistry (Orange, 16%) and Medicine (Yellow, 30%) (Fig. 3A).
- It can be seen that the national HPC architecture supports Life Sciences research via Computerome (Fig. 3B) and Multidisciplinary research via ABACUS2.0 (Fig. 3C) respectively.
- The Cultural Heritage Cluster, KAC, is designed to support the Humanities and Social Sciences respectively (Fig. 3D, Currently only one publication).
- Computing power via ABACUS2.0 has mainly generated publications within the research areas of Chemistry & Biochemistry, Physics and Computerscience & AI (Fig. 4A).
- Computing power via Computerome has in particular generated publications within the research areas of Biology and Medicine (Fig. 4B).
- The total number of publications has doubled from 290 to now 576 since the analysis was first conducted in 2017 (Fig. 5).
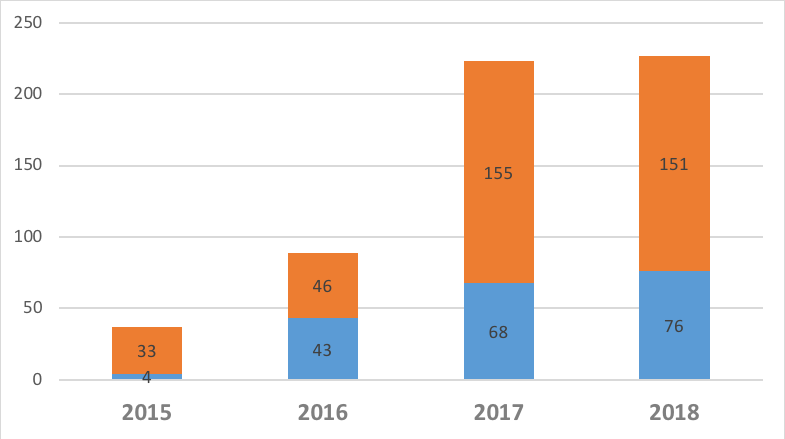
Figure 2. Total number of scientific publications per year per national HPC facility for the period 2015 to 2018 (N = 576). Blue, Publications from ABACUS2.0. Orange, Publications from COMPUTEROME
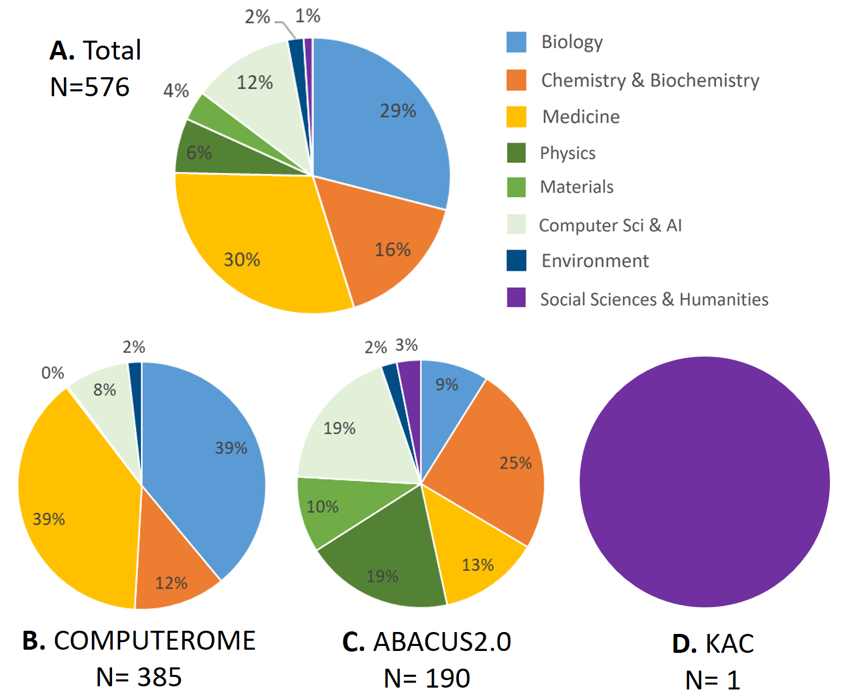
Figure 3. A. Distribution (%) of 576 scientific publications in the period 2015 to 2018 using High Performance Computing (HPC) from national facilities in DK. Indication of research area of the journal that was published in (Journal Impact Factor Category). B. Percentage of publications that have included computing power from COMPUTEROME broken down by research area. C. Percentage of publications that have included computing power from ABACUS2.0 broken down by research area. D. Percentage of publications that have included computing power by KAC divided by research area.
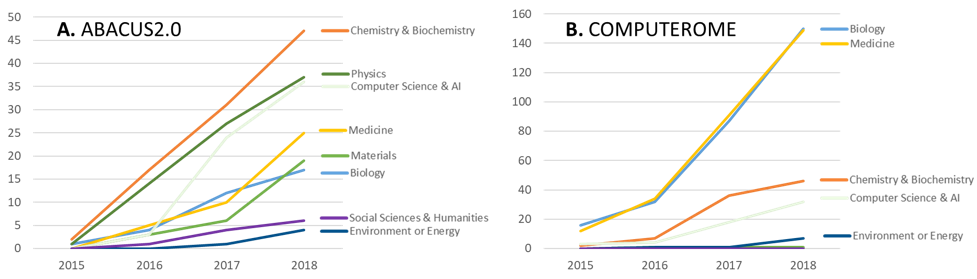
Figure 4. Cumulative plot of number of publications in the period 2015 to 2018 that included the use of national HPC per year - Sorted by research area per HPC facility.
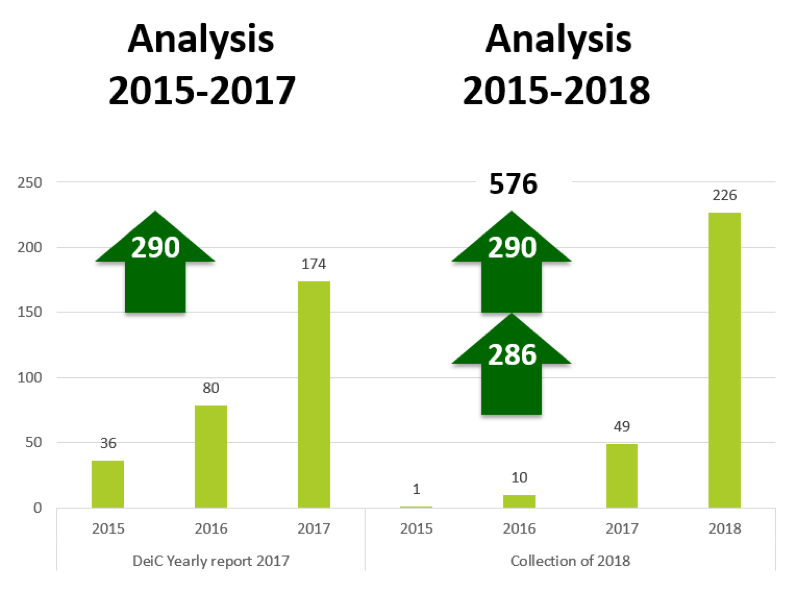
Figure 5. Number of scientific publications per year collected for the analysis in 2017 and 2018 respectively. Data is based on user verification of each publication and cannot be recreated through a bibliometric search, as it is not stated in the "Acknowledgments" or "Funding" field for 80% of the publications.
Diversity and impact
Here is information on visibility and impact for the 576 publications that included national HPC in the period 2015 to 2018. This is illustrated by means of field-weighted citations for the publications as well as the share in the top 10% most cited publications worldwide. Diversity refers to the breadth of research results disseminated through various journals.
FWCI
In the analysis for 2015 to 2018, the field-weighted citation impact (FWCI) is used for each publication from the Scopus database and the SciVal metrics module. The FWCI is the proportion of total citations for a given number of publications divided by the expected number of citations based on the average for the particular scientific field. An FWCI of 1 lives up to the global average. For FWCI> 1, the citation rate is higher than expected compared to the global average. For FWCI <1, the citation rate is less than the global average. A score of 1.6 means that the publications received 60% more citations than the world average for the discipline.
JIF
One way to rank international journals, in which science is published (publications), is to measure a citation index using the Journal Impact Factor (JIF). A JIF of 3 indicates that on average scientific publications from the journal in question are cited 3 times based on data from the last two years. It is seen that the higher the JIF of a journal, the more scientifically considered the publication in question (McVeigh et al. (2009)).
- A total of 38.9% of publications are in the top 10% most cited publications in the world for 2015 to 2018 (Fig. 6A), which is a high rate. This contributes to raising the average for Denmark's total population of publications in the top 10% most cited worldwide, which in "Forskningsbarometret" 2018 was estimated at 19.4% for 2013 to 2017.
- A total of 36.5% of the publications are published in the top 10% of the most cited journals worldwide (Fig. 6A).
- The average FWCI is 3.53 for the 576 publications that included DK-HPC, which is higher than the global average and higher than the total number of publications in DK (Fig. 6A).
- The 2015-2018 publication analysis shows higher field-weighted citation impact compared to total DK, the Nordic region and the OECD for 4 out of 6 subject areas (Fig. 6B, Green curve DK-HPC). So far, only 7 publications from the Social Sciences and Humanities have been registered, which may explain low FWCI for these areas.
- The 576 publications were available in 299 different international journals. This underscores great diversity in the dissemination of research findings, as the 2015 to 2017 analysis identified 290 publications in 168 journals. This indicates that it is a priority to disseminate research internationally as widely as possible in new journals.
- A total of 99 publications (17%) were published in highly acclaimed journals with JIF values above 10 (Table 1, Fig. 7). Ten publications are available in the journal Nature and 5 in Science. In addition, there are now two publications in the New England Journal of Medicine, which have a JIF of 70.
- A high JIF score for the journal in which the publication is published does not mean a high visibility (FWCI) for the individual publication (Figures 8 and 9, Top10 publications with FWCI and JIF). It can be seen e.g. that the two most cited publications in Life Science (FWCI> 100) are from journals with JIF of 10, while number 4 in the list is published in journals with JIF of 70 (Fig. 8). The same trend is seen for the publications outside the Life Science area, where Physics is represented for Top1 (FWCI> 15, JIF 5.3) and Top2 (FWCI> 10, JIF 0.26) respectively, while Top5 in Materials has FWCI of 8 and JIF or 6.8 (Fig. 9).
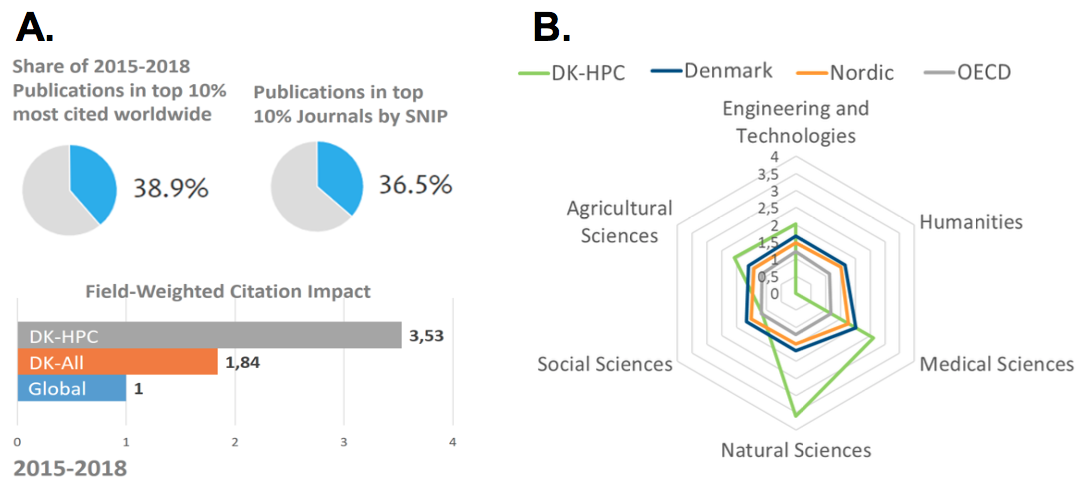
Figure 6. Field-weighted impact (FWCI) of publications from 2015 to 2018 that included the use of DeiC national HPC. Data from SciVal (Scopus). A. Top: Proportion of publications in Top10 most cited in the world and Top10 journals respectively. SNIP (Top10% Journals); Source normalized impact per publication (SNIP citations are normalized to correct differences in citation practices between scientific fields). Bottom: FWCI average for the total number of publications. B. FWCI by research area and comparison of DK-HPC (N = 576) with the entire collection of publications in the area of Denmark, the Nordic and the OECD countries.
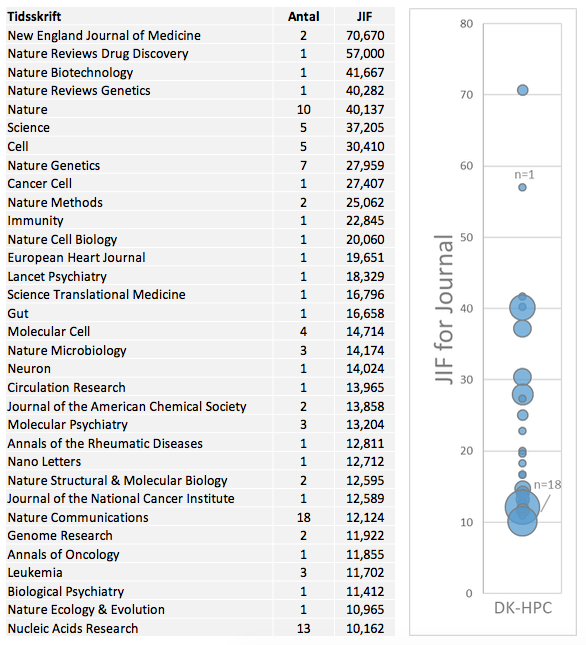
Tabel 1. A total of 99 of the 576 publications that included national HPC (17%) have been published in 33 journals within the Life Science area with JIF > 10. Indication of international journal ranking by JIF, Journal Impact Factor (2017). Figure 7. Distribution of DK-HPC publications with JIF > 10. Circle size indicates number.
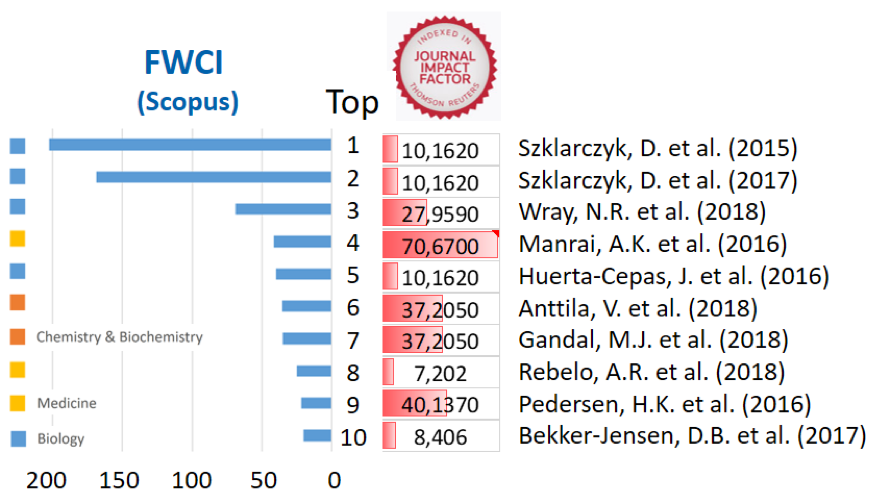
Figure 8. Top 10 most cited publications from the 576 publications that included national HPC in the period 2015 to 2018 (SciVal 15102019). Indication of FWCI value for each publication (Left: Blue bar plot) as well as JIF value for the journal the publication in question was available in (Right: Red bar plot). Scientific area is also indicated on the left of the figure (Color code for respectively Biology (Blue), Medicine (Yellow) and Chemistry & Biochemistry (Orange)).
Links to Top10: 1, Szklarczyk, D. et al. (2015); 2, Szklarczyk, D. et al. (2017); 3, Wray, N.R. et al. (2018); 4, Manrai, A.K. et al. (2016); 5, Huerta-Cepas, J. et al. (2016); 6, Anttila, V. et al. (2018); 7, Gandal, M.J. et al. (2018); 8, Rebelo, A.R. et al. (2018); 9, Pedersen, H.K. et al. (2016); 10, Bekker-Jensen, D.B. et al. (2017).
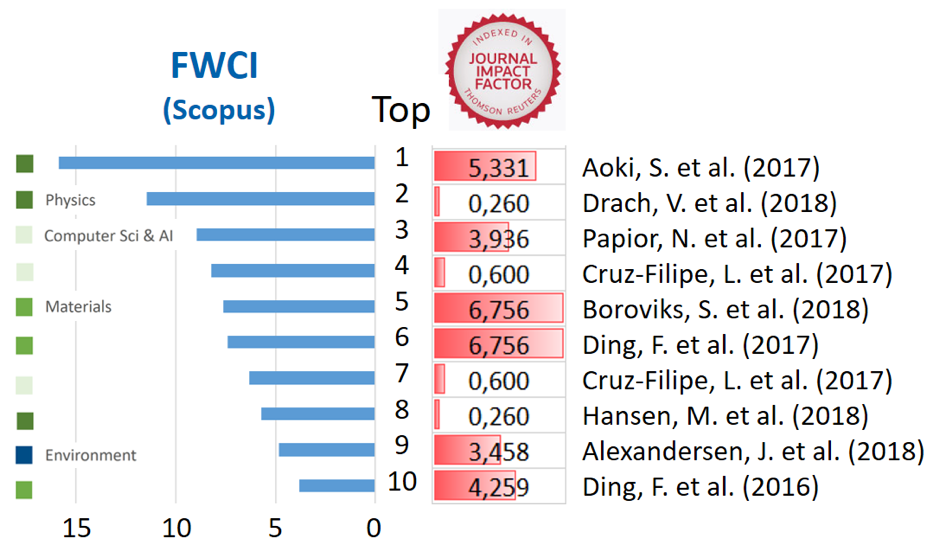
Figur 9. Top 10 most cited publications from the 576 publications that included national HPC in the period 2015 to 2018, within the areas of Physics (Dark Green) and Environment / Energy (Blue), as well as Materials (Medium Green) and Computer Science & AI (Light Green). See figure text from Fig. 8
Links to Top10: 1, Aoki, S. et al. (2017); 2, Drach, V. et al. (2018); 3, Papior, N. et al. (2017); 4, Cruz-Filipe, L. et al. (2017); 5, Boroviks, S. et al. (2018); 6, Ding, F. et al. (2017); 7, Cruz-Filipe, L. et al. (2017); 8, Hansen, M. et al. (2018); 9, Alexandersen, J. et al. (2018); 10, Ding, F. et al. (2016).
Cooperations patterns
Here you can find information on collaborative patterns identified by authorship of the publications, nationally (collaboration across universities), internationally and with industry / sector research institutions respectively. Collaboration can be seen as a way to develop new competencies - across universities and across borders.
- KU (n = 262 of the 576 publications), DTU (n = 199) and SDU (n = 195) had the authorship on the majority of publications that included national HPC (Fig. 10). The proportion of publications that came exclusively from institutes from one of the 8 universities is indicated in blue, while publications that included collaboration across Danish universities are indicated in orange.
- On average, in 67% of the publications, international cooperation was distributed across 83 countries through more than 3000 research units distributed across more than 500 unique institutions (Fig. 11A). Collaboration patterns per university can be seen in Fig. 11B in alphabetical order, and the proportion of publications in which each university co-authored the publication is given in Fig. 11C.
- Industry was represented in 12% of publications that included national HPC and sector research was represented in 23% of publications (Fig. 12A). A total of 194 publications, corresponding to the 35% that included collaboration with industry or sector research, accumulated over a four-year period (Fig. 12B).
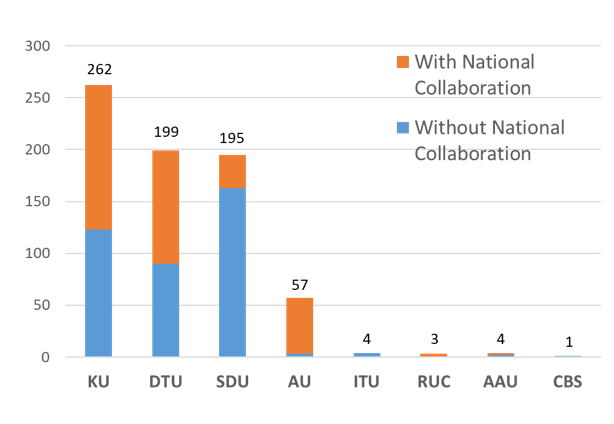
Figure 10. The number of times the respective Danish universities have authored on the total of 576 publications that included national HPC. Blue color, Only institutes from that university. Orange color, Collaboration with other Danish universities. In this part of the analysis there is +/- cooperation with abroad and / or industry within both categories.
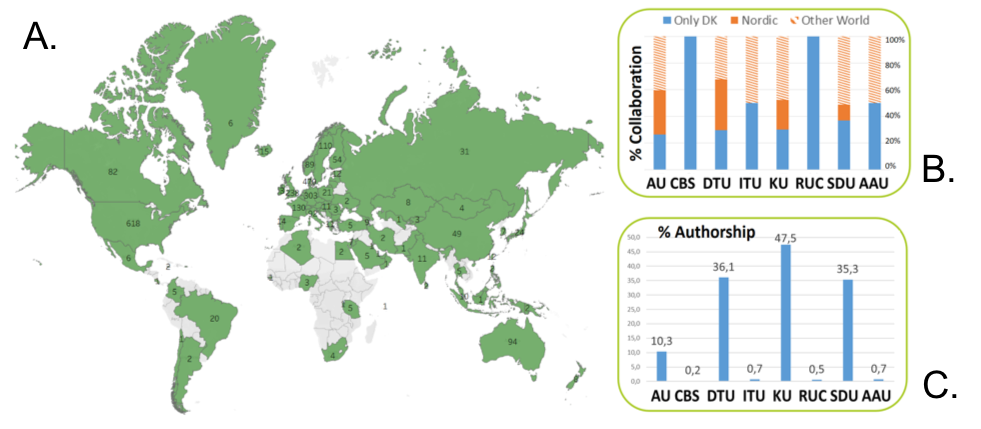
Figure 11. A. International cooperation across 83 countries through more than 3000 research units. B. Collaboration patterns per university in alphabetical order. C. The proportion of publications in which each university is co-authored among the 576 publications in this analysis.
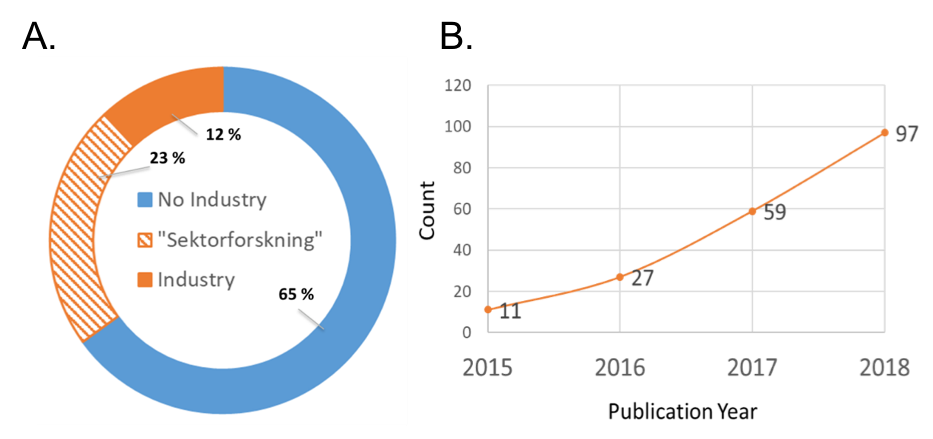
Figure 12. A. Collaboration with industry and sector research institutions stated by authorship in 576 publications that included the use of national HPC. B. Percentage of publications per year that included collaboration with industry or sector research (A total of 194 publications corresponding to 35%).
Hot topics in DK-HPC
How prominent and visited a topic is in the sciences ("Topic prominence") can be calculated from the number of citations, citescore and "views" in Scopus. The higher the prominence percentile, the more it is a focus area (Top10% ranges from 0.9-0.99 percentile). Popularly, one could say that a high-prominence percentile with a high probability is a "hot topic" in a specific science. This does not mean that low prominence research is not important, there is just not as much focus on the area as measured by the above parameters.
- Below is a more detailed overview of scientific disciplines that have used DeiC national HPC from 2015 to 2018 (Fig. 13). It is seen that publications from Computerome mainly refer to Life Science and Natural Sciences (Red circles, Fig. 13A). Publications from ABACUS2.0 mainly refer to Computer Science and Physics (Blue and purple circles), but Social Scienes are also represented (Yellow circles, Fig. 13B).
- Description of "Topic Prominence Clusters" for ABACUS2.0 and Computerome are found in Tables 1 and 2 respectively.
- You can find more details in the report: LINK
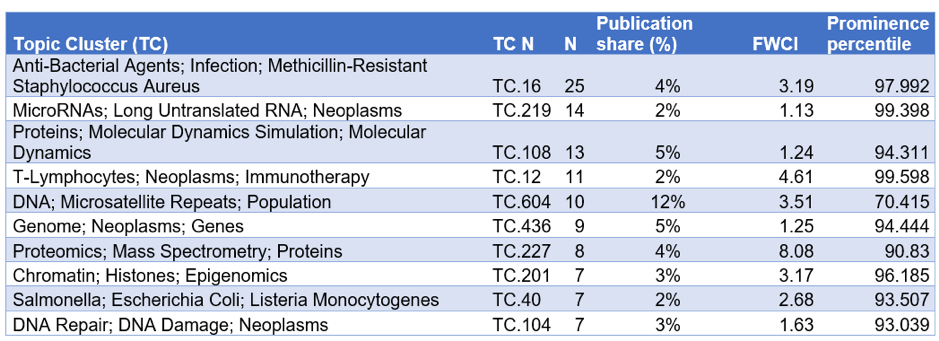
Table 1. Top 10 Topic Prominence Clusters for publications that have used computing power from Computerome (N = 385) in the period 2015 to 2018.
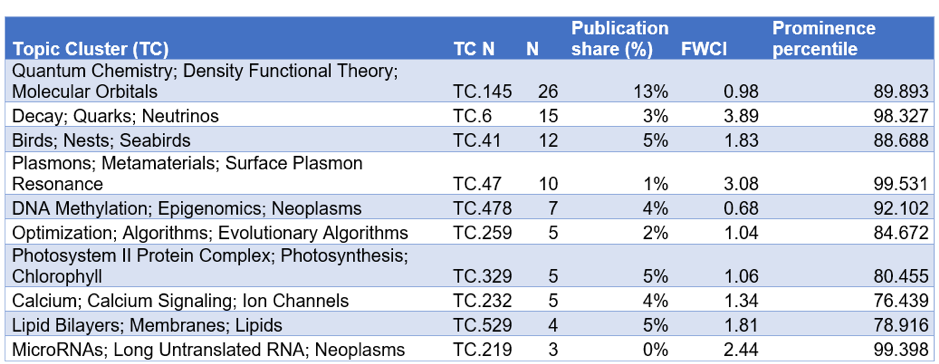
Table 2. Top 10 Topic Prominence Clusters for publications that have used computing power from ABACUS2.0 (N = 190) during the period 2015 to 2018.
Fun facts
Here are more details about the research that used national HPC in the period 2015 to 2018 based on the collected and user-verified dataset of 576 publications.
- How much open software such as "R" is used in the scientific publications?
A total of 20% of the publications included the use of “R”, and more than 100 unique R packages were used for data analysis. See previous analysis of the R package landscape HERE. - There is a lot of attention on "Open Science", but how many actually publish their results in an open journal?
A total of 59% of the publications in this analysis are "Open Access" according to Scopus. This includes that the publication is either a) published in an open journal or b) paid to make the publication open or c) a parallel publication has been made as a freely available reprint alongside the publication in a journal. - Which scientific topic or tool is highlighted the most in the 576 publications?
A total of 54% of publications included genome analysis using computing power on a national supercomputer. Analyzes were used in areas such as (Fig. 14):- The human genome. E.g. diagnosis and causes of cardiovascular diseases, cancer and diabetes, as well as analysis of gut flora (Microbiome), twin genomes, ancient people's pre-emergence and epigenetic expression of the human genome, etc.
- Genomes from plant and animal kingdoms. E.g. mapping genomes for minks, wolves and horses as well as honey bees, hornets and plant-eating insects.
- Genomes from viruses and bacteria. E.g. human and animal microbiome, viruses in wastewater, spread of infectious diseases and antimicrobial resistance from toilet waste in aircrafts and metagenomics of the ice of Greenland.
- How much open software such as "R" is used in the scientific publications?
A total of 20% of the publications included the use of “R”, and more than 100 unique R packages were used for data analysis. See previous analysis of the R package landscape HERE.
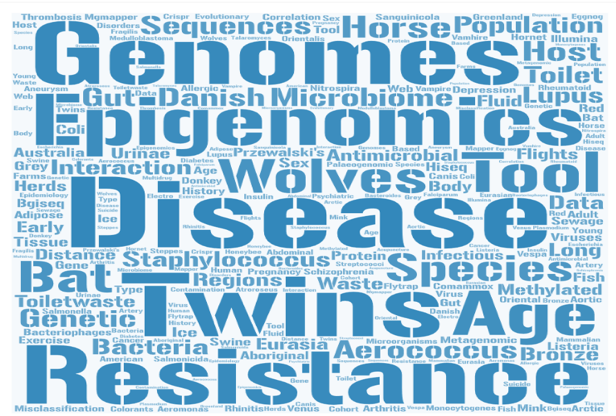
Figure 15. Topics that have included genome analysis in 54% of the publications in this analysis. Wordart made from the titles of the publications.
The presentation from the DeiC conference 2019 can be found here:
The analysis for 2015-2018 was done in collaboration with the national HPC centers. We would like to thank Myhanh Nguyen, Tom Olsen and Desirée Suhr Pérez for coordinating contact with HPC users as well as Jeannette Ekstrøm and Dorte Drongstrup for bibliographic data collection and input into metrics. The analysis was prepared by Birgitte Vedel Thage, DeiC Competence Center.