Since the establishment of the national HPC facilities in 2014 and 2015, the number of scientific publications has only increased. This analysis was first published in DeiC's annual report for 2017, where a total of 290 publications were registered for the period 2015-2017. The list now counts 835 publications for the period 2015 to 2019, ie. a five-year period.
This overview draws a landscape of the scientific publications which have included computing power from one of the three national HPC plants respectively within Life Science (Computerome), multidisciplinary research (ABACUS2.0) and the social sciences and humanities (Cultural Heritage Cluster, KAC ).
Content of the page
- Collection of publications
- New on the national list
- Interactive list - Free text search and downloads
- UN World Goals and publication list
- Open Access
- Number and research areas
- Diversity and impact
- Cooperation patterns
- "Hot topics" fra DK-HPC
- Report with detailed information
- Webinar
Collection of publications
A total of 835 publications highlight the use of national HPC in Danish research in the period 2015 to 2019, and this picture cannot be drawn in the normal bibliographic way. Less than 20% of publications are "captured" by a bibliometric search (It is not written in the "Acknowledgment" or "Funding" field in the publication), and therefore the national HPC users have subsequently had to indicate specifically which computing power they have used.
In this analysis, each publication has been verified by HPC users, to get a true picture of how many publications have actually included national HPC.
New on the national list
The list now includes almost a doubling of publications from the social sciences and humanities, as the number has increased from 7 to 12 scientific articles in areas such as. economics, language and communication, analysis of the Danish world-wide web and 3D modeling within archeology. Searching for publications within 8 subject areas can now, as something new, easily be done online at:https://www.deic.dk/Supercomputere/HPC-publikationer.
For the first time, it is examined how many of the list's publications will contribute to the UN's global goals for sustainability in 2030. You can read more about this HERE.
In addition, the "Open Access" share of national DK-HPC publications is described HERE.
Interactive list - Free text search and downloads - NEW
Here it is possible to explore the 835 publications that have included the use of national supercomputing in Denmark in the period 2015 to 2019. The list currently includes. also a single additional publication from 2020.
- You can do a full-text search in the title of the publication in the field "Full text search"
- You can create your own list of publications based on e.g. year, HPC system that was used, and which Danish university is included in the publication.
- You can also create lists that are sorted by research area as well as journals that were published in.
- The DOI is specified for each publication in the search results.
- You can download your lists to Excel after each search.
- Search fields are described in more detail in Table 1.
| Search Field | Identifyers and Explanation |
|---|---|
| Full text | Search for a specific key word of part of a terminology in the title of the scientific publication. You can also search for a specific DOI number in this field. |
| Year | 2015, 2016, 2017, 2018, 2019 or mark all for a total list. |
| HPC | Choose supercomputing facility in DK: ABACUS2.0, Computerome or KAC. |
| University | Here it is possible to generate a list of national DK-HPC publications from each of the 8 Danish universities. "Others" / "NoDKUni" refers to companies, hospitals or "Sector research institutions". |
| Scientific Field | Choose one of the 8 scientific fields or mark all for a total list. |
| Journal | Name of the journal that the publication was published in. You can e.g. see the list of publication in a given journal. The list contains more than 400 journals that the publications are available from. |
UN World Goals and publication list - NY
How do the national DK-HPC publications contribute to the UN's goals for sustainable development in the world? The Danish universities have begun to include the UN's 17 world goals in their strategy and visions. Most of the goals have the common denominator that technology will play a crucial role in solving the global challenges of the future, which include eradicating world poverty and hunger, helping our climate, reducing inequalities, ensuring good education and better health for all, sustainable economically growth, etc.
- A total of 353 publications (44%) were matched with an SDG (Sustainable Development Goal), of which the majority (339 publications) were categorized within SDG # 3: “Health and well-being” (Fig. 1).
- For SDG3, one can read that globally, one in four is affected at some point in life by mental illness and neurological disorders. More than 300 million people suffer from depression, almost as many have severe anxiety disorders and more than 800,000 people commit suicide each year [1]. These topics include has been elucidated through national DK-HPC, and in addition the 339 publications include studies of more than 50 different diseases, among others. using genome sequencing, epigenetic studies and disease progression analysis. You can explore the titles of the publications HERE (coming soon).
- The 353 publications that matched with an SDG goal were divided between 8 disciplines with emphasis on Life Science, which i.a. represents the health area (Fig. 2).
- Some publications were to be found within SDG2 (Stop hunger), SDG7 (Sustainable energy), SDG11 (Sustainable cities and communities), SDG13 (Climate efforts) and SDG15 (Life on land).
- It is noted that SDG6 (Clean Water and Sanitation) and SDG14 (Life at Sea) had no match in this analysis, although potential candidates were to be found among the 835 national DK-HPC publications.
- It is emphasized that the results presented here must be interpreted with caution, as an algorithm has not yet been developed that can perfectly assess and categorize the research publications as belonging to one or more of the world's objectives [2].
- This study uses a set of search criteria developed by Elsevier [3]
[1] Sayers, S. et al. (2019) 2030 Now. 17 goals, 9 billion people, 1 future. Life Publishing Aps, Kbh. ISBN: 978-87-997573-2-9.
[2] Armitage, C. S. et al. (2020) Mapping scholarly publications related to the Sustainable Development Goals: Do independent bibliometric approaches get the same results? Quantitative Science Studies. Advance Publication. DOI: 10.1162/qss_a_00071.
[3] Jayabalasingham, B. et al. (2019) Identifying research supporting the United Nations Sustainable Development Goals, Mendeley Data (1 ed.). Scopus search queries developed by Elsevier, DOI: 10.17632/87txkw7khs.1
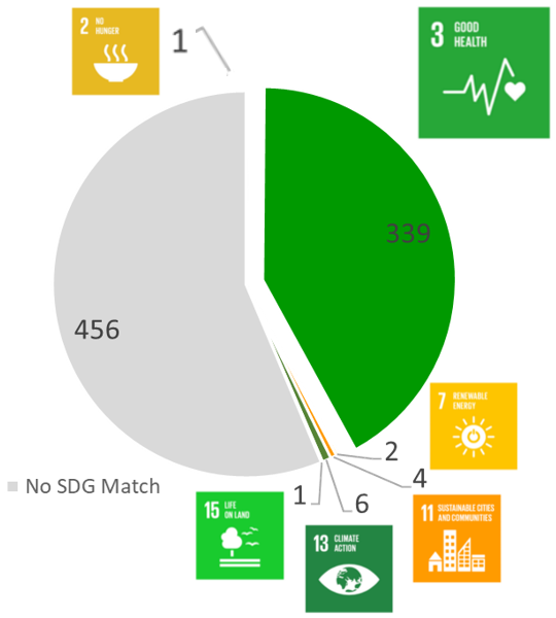
Figure 1. ANumber of national DK-HPC publications that could be matched with one of the UN's 17 world goals (SDG, Sustainability Development Goals).
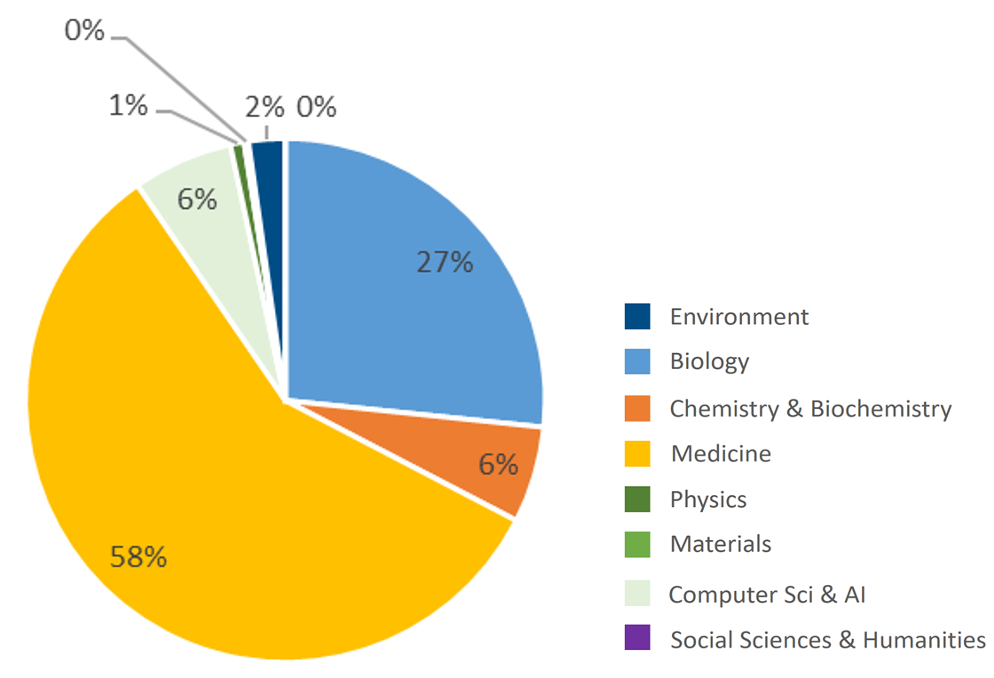
Figure 2. Distribution of the 353 national DK-HPC publications that could be matched with one of the UN's 17 world goals, within subject disciplines (JIF category for journal).
Open Access (OA) - NY
The publication of a scientific publication may be made available free of charge on the journal's website. This is an important parameter in relation to Open Science. Publications can be indexed as being "Gold", "Hybrid" or "Green" OA, which means that publications are respectively free, paid to be free or available for free access via parallel publishing (the latter is, for example, "Self-archiving" in the universities' archives and made available that way).
- A total of 60% of the DK-HPC articles are registered as Open Access (OA) in Scopus on average for the period 2015 to 2019. This is the sum of "Gold" and "Hybrid" OA.
- All 8 disciplines are represented in the OA part, where “front runners” are the Life Science areas Biology and Medicine (Fig 3A). All 8 disciplines also have publications that are not OA available (Fig. 3B).
- A lower% increase (Fig. 4, blue curve) is seen in the development in OA for the DK-HPC publications over the last 5 years based on “Gold” and “Hybrid” OA, while “The Danish Open Access Indicator”, where “Green” OA is also included when 78% for 2018 (Fig. 4, orange curve).
- The Danish Open Access Indicator contains publications that are respectively "Gold", "Hybrid" and "Green" OA, and thus includes a wider spectrum of OA publications than what we can discover in Scopus for the national DK-HPC analysis.
- For comparison, there were respectively 36%, 45% and 54% free access to the total Danish research publications from 2016, 2017 and 2018 via "The Danish Open Access Indicator" (Fig 4, DK-All-OA-DKI). These are lower values than for the publications with national DK-HPC.
- A total of 96% of the HPC publications were matched with the Danish Open Access Indicator.
- A total of 97% of the 835 publications were matched in Scopus.
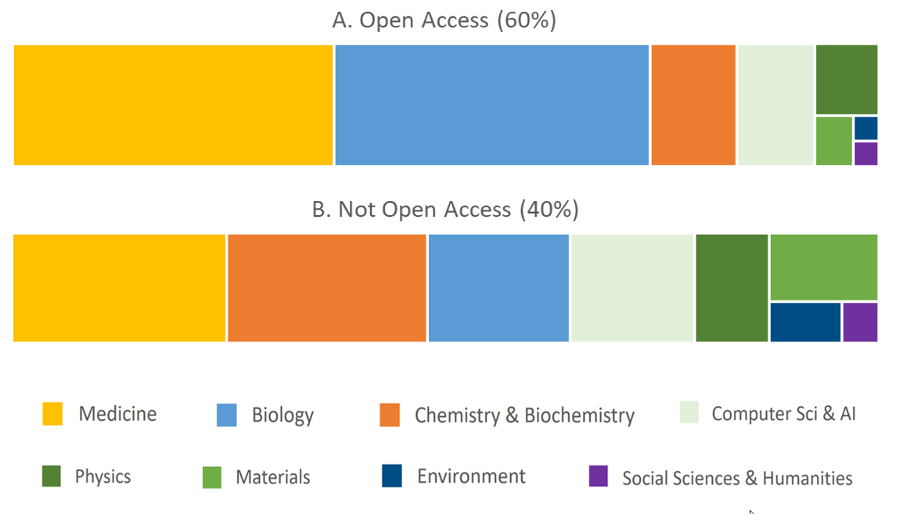
Figure 3. Total distribution in the period 2015 to 2019 of national DK-HPC publications that were categorized as being "Open Access" with an indication of disciplines. A. Open Access (N = 490) and B. No Open Access (N = 315).
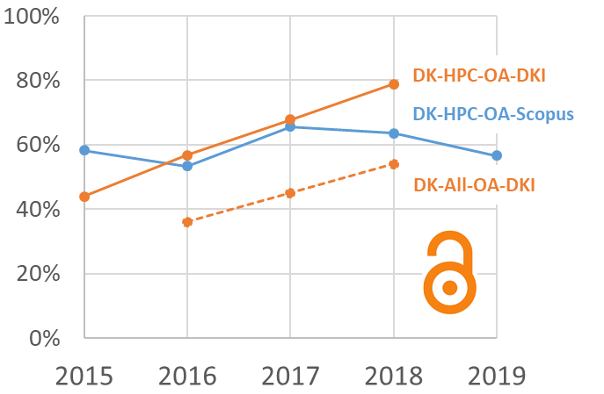
Figure 4. Annual share of national DK-HPC publications attributable to "Open Access" (OA) out of the 805 publications found in Scopus (solid lines). Comparison with total number of Danish publications (Dotted line). More details in text.
Numbers and research areas
Here is information about research productivity (Number of publications) and which subject areas have found their way to national supercomputing in DK in the period 2015 to 2019.
- The total number of publications has almost tripled since the analysis was first conducted in 2017 (Fig. 5)
- Since the launch of the national HPC plants, 835 publications have been generated that included the use of national DK-HPC (Fig.6).
- Most HPC users are within the research areas Biology (Blue, 28%), Chemistry & Biochemistry (Orange, 15%) and Medicine (Yellow, 32%) (Fig. 7A).
- It is seen that the national HPC architecture has supported Life Sciences research via COMPUTEROME (Fig. 7B) and multidisciplinary research via ABACUS2.0 (Fig. 7C). The Cultural Heritage Cluster, KAC, was designed to support humanities and social sciences (Fig. 7D, Currently only two publications).
- A new national DK-HPC structure is being established in 2020.
- Different subject areas from the 8 Danish universities have used national HPC (Fig. 8). SDU has all 8 subject groups represented over the last 5 years, whereas DTU, KU and AU (and partly AAU) are mainly represented within the Life Science area (Blue, orange and yellow square). Few professional groups are represented from CBS, ITU and RUC respectively. The social sciences and humanities are represented from CBS, SDU and AU (Purple Square) respectively.
- A new national DK-HPC structure is being established in 2020.
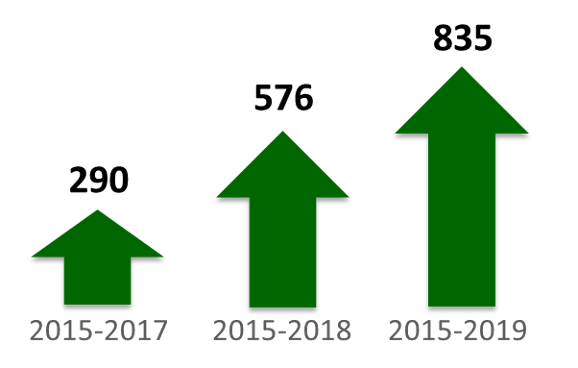
Figure 5. Number of scientific publications collected for the analysis in 2017 (3-year period), 2018 (4-year period) and 2019 (5-year period), respectively.
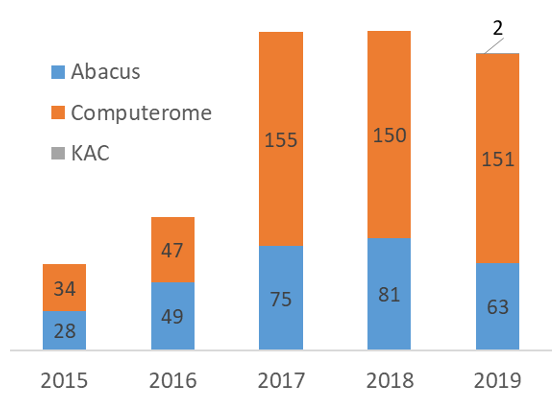
Figure 6. Total number of scientific publications per year per national HPC plant for the period 2015 to 2019 (N = 835).
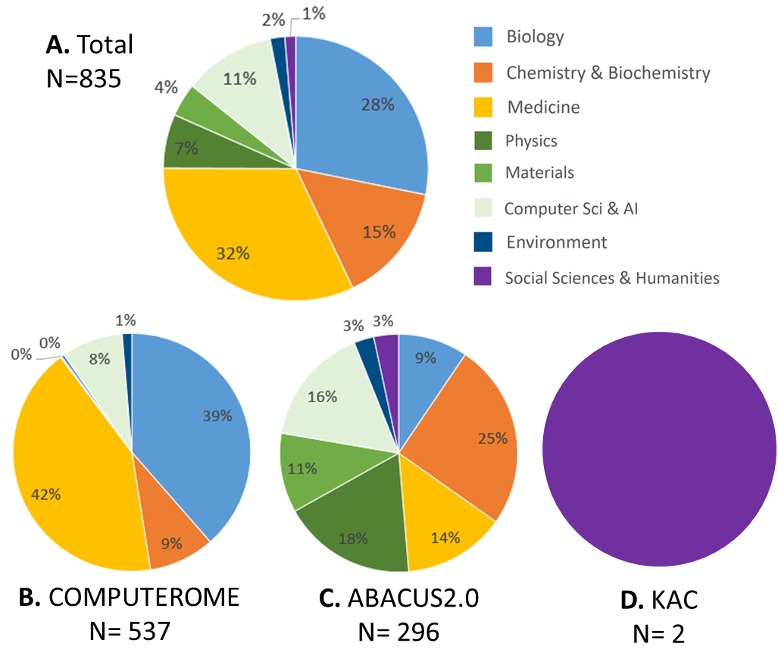
Figure 7. A. Distribution (%) of 835 scientific publications in the period 2015 to 2019 that used High Performance Computing (HPC) from national facilities in DK. Indication of research area for the journal, which was published in (Journal Impact Factor Category). B. Proportion of publications that have included computing power from COMPUTEROME divided by subject area. C. Proportion of publications that have included computing power from ABACUS2.0 divided by subject area. D. Proportion of publications that have included computing power from KAC divided by subject area.
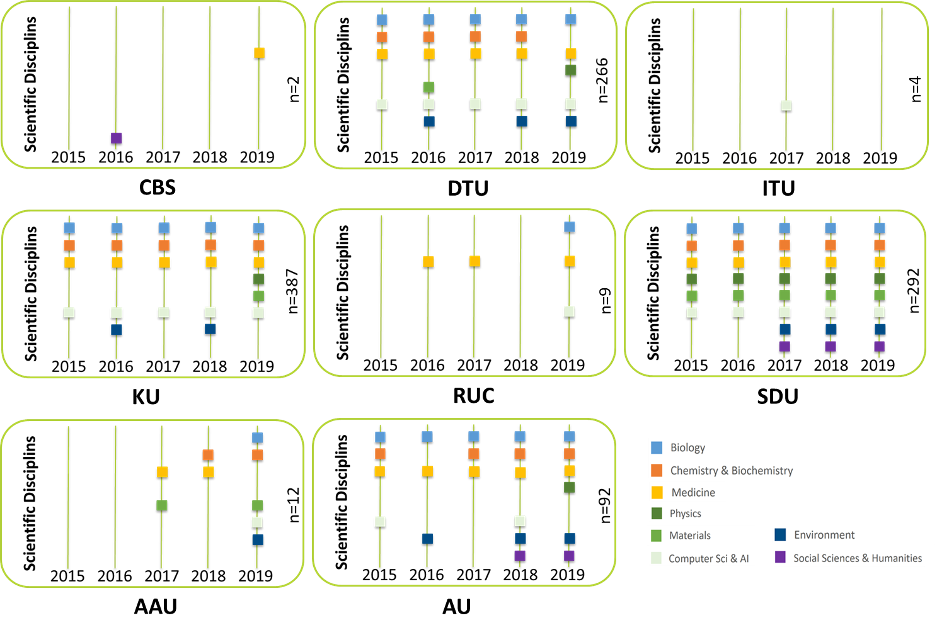
Figure 8. Areas of expertise that have used national HPC, sorted by university and year. Data are based on journal category from the total of 835 publications collected for the period 2015 to 2019. If more than one of the Danish universities is represented by an author on one publication, it counts in several places.
Diversity and impact
Here is information on visibility and impact for the 835 publications that included national HPC in the period 2015 to 2019. This is illustrated by field-weighted citations for the publications as well as the share of publication in the top 10% most cited worldwide. Diversity refers to how widely research results are disseminated through different journals.
A description of FWCI and JIF can be found in the analysis from last year.
- A total of 40% of the publications are to be found in the top 10% most cited publications in the world for 2015 to 2019 (Fig. 9A), which is a high rate. This contributes to increasing the average for Denmark's total population of publications in the top 10% most cited worldwide, which in the same period was estimated at 22%.
- A total of 36% of the publications are visible in the top 10% of the most cited journals worldwide (Fig. 9B). This is higher than for Denmark's total population of publications (23%).
- The average FWCI is 3.74 for the 835 publications that included DK-HPC (Fig. 9D, blue bar), which is higher than the global average and higher than the total number of publications in DK and the OECD countries (Fig. 9D, gray and green bar respectively).
- The publication analysis for 2015-2019 shows higher field-weighted citation impact compared with total DK and OECD for 4 out of 6 subject areas (Fig. 9D, national HPC blue curve). So far, only 12 publications from the social sciences and humanities have been registered, which may explain the low FWCI for these areas.
- The 835 publications were available in 412 different international journals. This underscores the great diversity in the dissemination of research results, as the analysis from 2015 to 2018 identified 576 publications in 299 journals. This indicates that it is still a priority to disseminate its research internationally as widely as possible in new journals. Explore the 412 magazines HERE.
- A total of 17% of the publications are published in highly recognized time shifts with JIF values above 10 (Fig. 9C). At the same time, 40% of the publications can be found in the top 10 most cited publications in the world (Fig. 9A), which shows that many of the most cited publications can be located in time shifts without top ranking.
- Only 5% of the publications can be located in journals with the highest JIF ranking (Table 2). Thus, 12% of national HPC publications have a JIF between 10 and 25, with 17% having a JIF> 10 (See Fig. 9C).

Figure 9. Field-weighted impact (FWCI) of publications from 2015 to 2019 that included the use of DeiC national HPC. Data from SciVal (Scopus). A. Proportion of national HPC publications in Top10% most cited in the world. B. Proportion of national HPC publications in Top10% highest ranked journals in relation to SNIP (Source normalized impact per publication). SNIP takes into account the correction of differences in citation practice between scientific fields. C. Proportion of national HPC publications with Journal Impact Factor greater than 10 (JIF> 10). D. FWCI average for the total number of publications (National HPC, blue bar). E. FWCI divided by subject area and comparison of national HPC (blue curve) with the entire collection of publications within the area for resp. Denmark (gray curve) and the OECD countries (green curve).
| Journal (Top10 highest JIF) | # | JIF |
|---|---|---|
| New England Journal of Medicine | 2 | 70,67 |
| Nature Reviews Drug Discovery | 1 | 57 |
| Nature Biotechnology | 1 | 41,667 |
| Nature Reviews Genetics | 1 | 40,282 |
| Nature | 13 | 40,137 |
| Science | 5 | 37,205 |
| Cell | 6 | 30,41 |
| Nature Genetics | 11 | 27,959 |
| Cancer Cell | 1 | 27,407 |
| Nature Methods | 2 | 25,062 |
Cooperation patterns
Here, information on collaboration patterns is identified in authorship from the publications resp. nationally (Collaboration across universities), internationally and with industry / sector research institutions. Collaboration can be seen as a way to develop new competencies - across universities and national borders.
- KU (n = 387 of the 835 publications), DTU (n = 266) and SDU (n = 292) had the authorship of the majority of the publications that included national HPC (Fig. 10). The proportion of publications that came exclusively from departments from one of the 8 universities is indicated in blue, while publications that included collaboration across Danish universities are indicated in orange.
- On average, in 68% of the publications, there was international collaboration spread over 110 countries via more than 3500 research units spread over more than 500 unique institutions (Fig. 11A).
- Industry was represented in 13% of the publications that included national HPC, and sectoral research was represented in 27% of the publications (Fig. 12A). A total of 332 publications, corresponding to the 40% that includedsamarbejde med industri eller sektorforkning, akkumulerede over en fire-årig periode (Fig. 12B).
- Almost every third publication (27%) included collaboration with hospitals from the Danish regions (Fig. 13).
- The Capital Region of Denmark and Southern Denmark were represented in most of the publications (Figs. 13 and 14), and a marked increase in the use of national HPC via the hospitals was identifiable from 2017 to 2018 (Fig. 14).
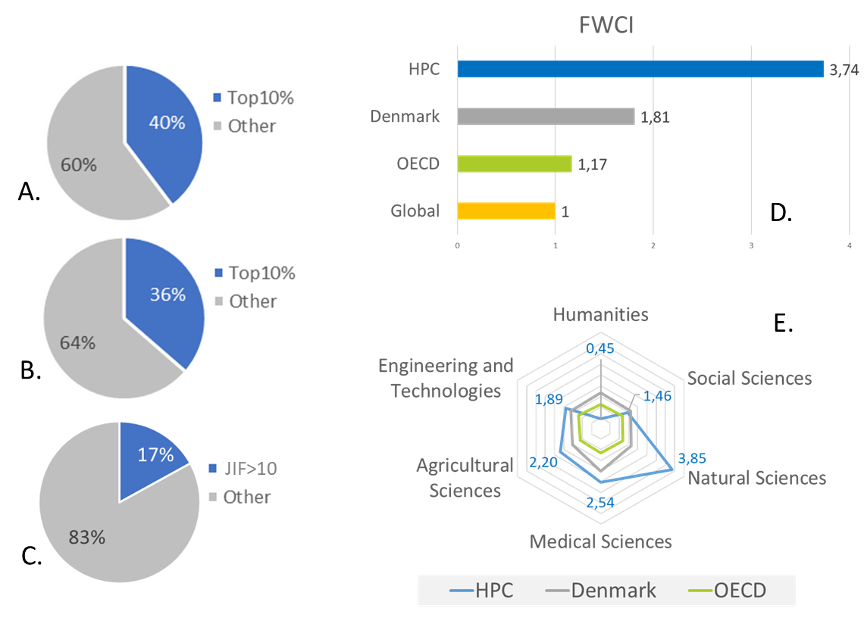
Figure 10. Number of times the respective Danish universities have authored a total of 576 publications that included national HPC. Blue color, Only departments from the university in question. Orange color, Collaboration with other Danish universities. In this part of the analysis, there is +/- cooperation with foreign and / or industry within both categories.
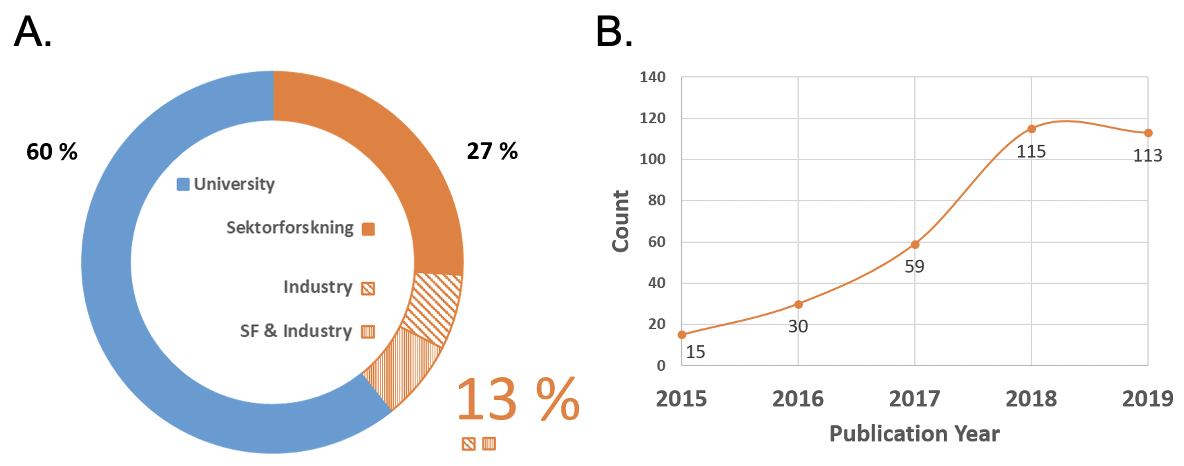
Figure 12. A. Collaboration with industry and sector research institutions compiled by authorship in 835 publications that included use of national HPC. B. Share of publications per. years that included collaboration with industry or sector research.
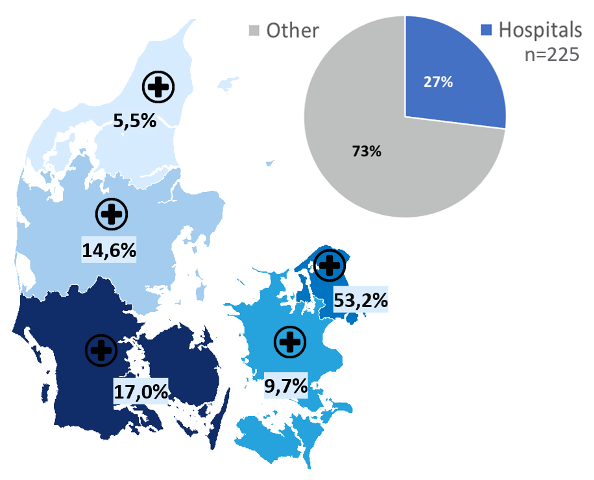
Figure 13. Proportion of publications with authorship from the Danish hospitals (Cake diagram) and indication of proportion from the regions (Map).
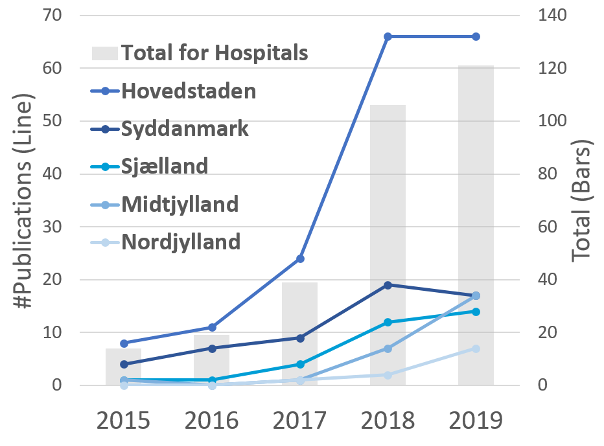
Figure 14. Share of publications per. years that included collaboration with Danish hospitals.
"Hot topics" from DK-HPC
How prominent and visited a topic is in the sciences ("Topic prominence") can be calculated from the number of citations, citescore and "views" in Scopus. The higher the prominence percentile, the more it is an area that is very much focused on (Top10% ranges from 0.9-0.99 percentile). Popularly speaking, one could say that a topic with a high prominence percentile with high probability is a "hot topic" within a specific science. This does not mean that research with low prominence is not important, there is just not as much focus on the area measured via the above parameters.
- Below is a more detailed overview of scientific disciplines that have used DeiC national HPC from 2015 to 2019 (Fig. 15). It is seen that the subjects of the publications are mainly attributed to life science and natural science (Red circles) as well as computer science and physics (Blue and purple circles), but also social scienes are represented (Yellow circles, Fig. 15).
- Description of "Topic prominence Clusters" for the total of 835 publications can be found in Table 2.
- You can find more details in the report: Link
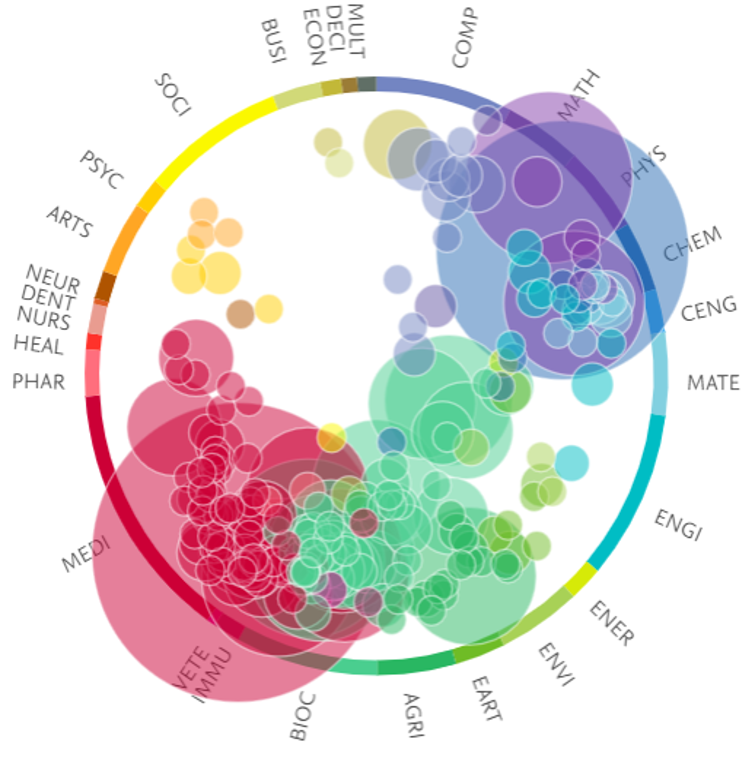
Figure 15. Scientific disciplines that have used DeiC national HPC in the period 2015 to 2019. Size of circles refers to number of publications. The larger the circle, the more publications within the "Topic prominence" in question. The plot is shown for the total of 835 publications (805 in Scopus).
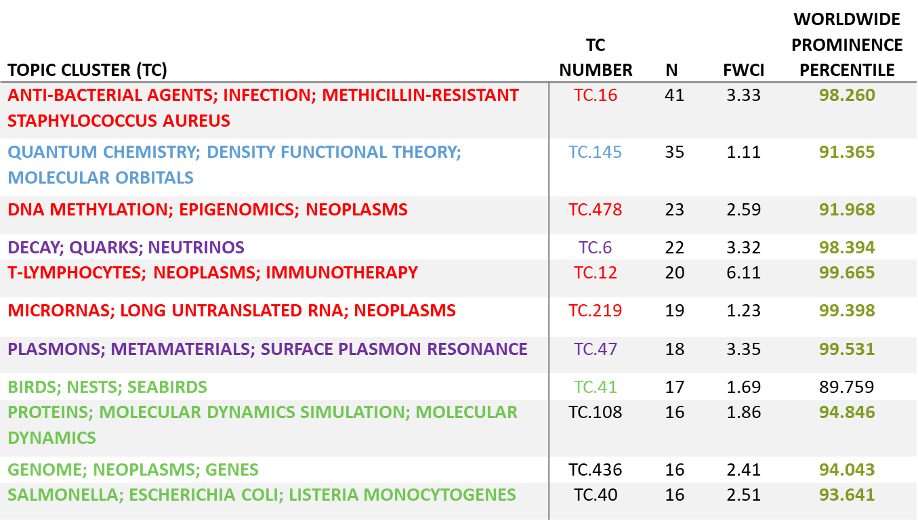
Table 3. Top10 Topic Prominence Clusters for publications that have used computing power (N = 835) in the period 2015 to 2019. Colors refer to the colors of the circles in Fig.15. Abbreviations: TC, Topic Cluser.
Rapport with detailed information
Here you will find more details about the bibliometric analysis for the 835 publications that included national DK-HPC.
- Research output overviews from the eight universities
- Research output from ABACUS2.0 and Computerome in DK, 2015 to 2019
Webinar
- The presentation in ppt format can be found HERE.
The analysis for 2015-2019 has been made in collaboration with the national HPC centers. We would like to thank Myhanh Nguyen, Tom Olsen and Desirée Suhr Pérez for coordinating the contact to the HPC users as well as Jeannette Ekstrøm, Dorte Drongstrup and Emil Rendbæk Nygaard for bibliographic data collection and input to metrics. The analysis was prepared by Birgitte Vedel Thage, DeiC Competence Center and Dorte Drongstrup, SDU.